Make Your Own Year-in-Music Recap Card (Without Copying Anyone’s Design)
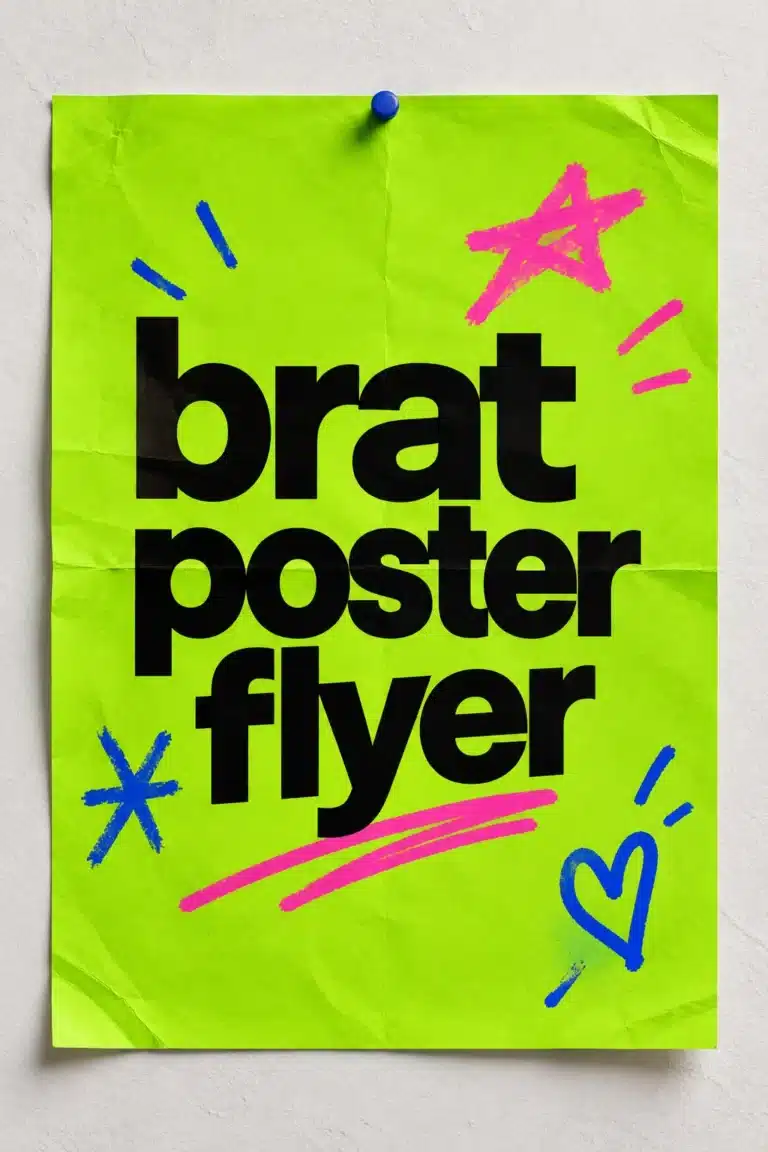
Streaming services publish their own annual recaps, and listeners enjoy sharing them. This guide shows how to make your own recap card from your personal listening notes, with a bold text design from the free Brat Text Generator. It does not copy any service’s branding, and you can use any data you like.
What goes on a recap card
| Element | Source |
|---|---|
| Headline | Your own phrase, such as “my year in music” |
| Top artist | From your listening history |
| Top track | From your listening history |
| Minutes or hours | If your service shows it |
| A personal line | Something only you would say |
Getting the numbers
Most streaming apps show listening stats in their own recap feature or in your account data. If yours does not, keep a manual list of favorites during the year.
Design steps
- Choose a square or vertical size. See the story size guide.
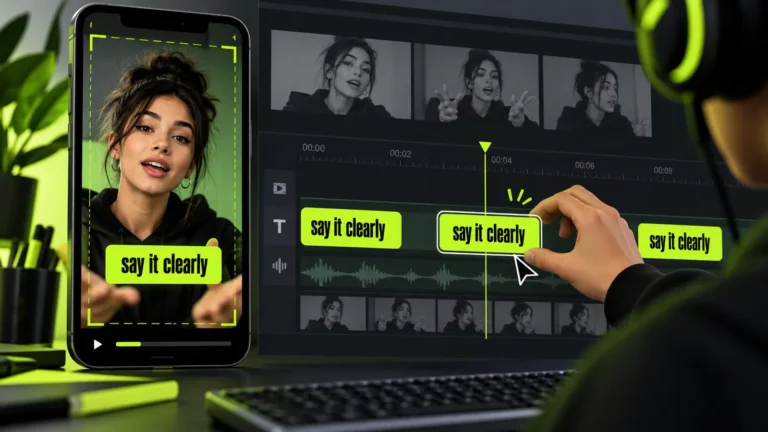
- Make a headline image in the generator.
- In a design or photo editor, add the stats as plain text below it.
- Keep to three stats; more makes the card unreadable.
- Export and share.
Keep it your own
Do not copy another company’s logo, layout or artwork. A simple card with a headline and three lines is more personal.
Privacy
Listening history can reveal habits. Share what you are comfortable with, and avoid including account names or location details.
A playlist to go with it
Turn your top songs into a playlist and use a matching cover. See the playlist cover guide.
Choosing which stats to show
Pick figures that tell a story: a top item, a surprising number and a trend. Present them in descending order of importance. Avoid cluttering the slide with more than four numbers.
Sharing responsibly
Stats can reveal habits. Share only what you are comfortable making public.
Slide order for a recap
Open with a title, show the three key stats, add one personal note and finish with a thank-you or call to action. Keep the same preset on every slide, and export at 1080 by 1920 for stories.
Keeping it accurate
Check every number against the source before you post, and avoid claims about other people’s habits.
A worked example: a three-line card
Suppose your year was mostly running music. Your card says: headline “my year in music”, then “most played: the same ten songs”, then “total: lots of miles”. You make the headline in the generator, place it at the top of a vertical canvas in an editor, and add the three lines below in a plain font. The card reads in seconds and is entirely your own wording.
Troubleshooting
| Symptom | Fix |
|---|---|
| Card looks crowded | Cut to three lines |
| Text too small on phones | Increase size; check on a phone |
| Stats are not available | Use your own notes or leave stats out |
| Colors clash | Use two colors only |
Making it personal
Stats are interesting, but stories are better. Add a line about a song that got you through something, or a concert you attended. Specific beats generic.
Sharing considerations
Before posting, think about what the card reveals: listening habits can show your routine. Share only what you are comfortable with.
Creating a group version
Friends can each make a card and combine them into a carousel. Agree on a layout beforehand so they match.
Choosing what to show
A good year-in-review graphic highlights three or four items, not twenty. Pick the figures that surprised you or that mean the most, give the biggest number the largest type and leave white space around it.
Privacy first
Listening and viewing habits can be personal. Only post what you are comfortable sharing publicly, and remove anything that reveals location or private details.
Making it shareable
Export a 9:16 version for stories and a square version for the feed, and write a short caption that adds a sentence of context.
Why recap graphics get shared
Year-in-review graphics work because they are personal, short and easy to compare with friends. The best ones show a few numbers or names and one clear headline, so the viewer understands them in a second.
Building the slide set step by step
- Decide the three or four things you want to show, such as a top item, a number of hours or a favourite genre.
- Write the headline for each slide in three words or fewer.
- Generate each headline in the Brat Text Generator using the same preset and the 9:16 size.
- Add the figure or name underneath in a plain text layer in your preferred editor.
- Export and check each slide on a phone.
Colour and contrast
Black on the default green keeps numbers readable. If you add a second colour for emphasis, use it only for the figure, not for the entire slide.
Privacy and accuracy
Use only data you are comfortable sharing publicly and double-check each number before posting. Recap data often comes from a platform’s own summary, so describe it as your own listening or viewing rather than making claims about other people.
Alternative formats
If you do not want to share stats, make a mood-based recap instead: three words for the year, one colour and one photo. It is just as shareable and keeps private data private.
Time-saving tips
Create all slides in one session using the same preset, and name the files in order. Check each one on a phone before posting.
Frequently asked questions
Can I share it on stories?
Yes; use a vertical size.
Are song titles okay to include?
Yes, titles are fine; avoid quoting lyrics.
Do I need the streaming service’s tools?
No, though they provide convenient numbers.
Can I include album art?
Album art belongs to its owners; avoid it unless you have permission.
What colours work best for stats?
High contrast, such as black text on the green, keeps numbers readable.
How do I keep a series consistent?
Reuse the same preset, font size and spacing for each slide.
Brat Generator is an independent tool and is not affiliated with, endorsed by, or sponsored by Charli XCX, her record label, or any related brand. Any album or trademark names are mentioned only to describe a visual style.